Article
신품종 토종닭의 계통과 성별에 따른 성장 특성에 관한 연구
A Study on Growth Pattern in a New Synthetic Korean Native Commercial Chicken by Sex and Strains
Kigon Kim1
,
Eun Sik Choi2,
See Hwan Sohn3,†
Author Information & Copyright ▼
1Researcher, Division of Animal Bioscience and Integrated Biotechnology, Gyeongsang National University, Jinju 52725, Republic of Korea
2Researcher, Gyeongsangnam-Do Provincial Government Livestock Research Institute, Sancheong 52263, Republic of Korea
3Professor, Division of Animal Bioscience and Integrated Biotechnology, Gyeongsang National University, Jinju 52725, Republic of Korea
© Copyright 2022, Korean Society of Poultry Science. This is an Open-Access article distributed under the terms of the
Creative Commons Attribution Non-Commercial License (http://creativecommons.org/licenses/by-nc/3.0/) which permits
unrestricted non-commercial use, distribution, and reproduction in any
medium, provided the original work is properly cited.
Received: Nov 15, 2022; Revised: Dec 13, 2022; Accepted: Dec 14, 2022
Published Online: Dec 31, 2022
적요
본 연구는 신품종 토종종계로부터 생산된 토종실용닭 4계통의 성장 특성을 규명하고 출하일령 추정에 적합한 모형을 제시하고자 실시하였다. 체중은 발생시부터 12주령까지 2주 간격으로 개체별로 측정하였으며 성장곡선의 추정은 Von Berteralanffy, Gompertz 및 Logistic 모형을 이용하였다. 분석 결과, 발생시 체중을 제외한 모든 주령에서 수컷이 암컷보다 무겁게 나타났고, 계통 간 체중은 발생시, 2주령 및 6주령을 제외하고는 차이가 없는 것으로 나타났다. 모든 성장곡선 모형의 결정계수와 수정된 결정계수는 97.4~99.7로 높은 적합도를 나타내었다. 성장곡선 모수 중 성숙체중과 성장률은 수컷이 암컷보다 높게 나타났고, 성숙률은 암컷과 수컷이 비슷한 값을 보였다. 변곡점은 모형과 계통 별 차이가 있으나 암컷은 약 7주령, 수컷은 8~9주령으로 나타나 성별 간 10일 정도의 차이를 나타내었다. 성장곡선 모형의 거의 대부분은 실제 체중과 잘 일치하나, Von Bertalanffy 모형에서 수컷의 체중이 실제 체중과 다소의 차이를 보였다. 출하일령 예측을 위한 회귀함수의 결정계수는 0.9583~0.9746으로 나타나 예측 값에 대한 신뢰도가 높게 나타났다. 성장곡선과 회귀식을 사용하여 추정한 주령 별 체중 값은 8주령과 10주령은 회귀식을 이용한 추정 값이, 12주령 체중은 Logistic 모형으로 추정한 값이 실제 체중과 가장 비슷하게 나타났다. 이러한 성장곡선에 따른 토종닭의 2 kg 도달일령의 평균 예측일수는 수컷이 62.0~64.6일, 암컷은 74.9~78.6일로 추정된다.
ABSTRACT
This study investigated the growth characteristics of four strains of newly developed synthetic Korean native commercial chickens (KNCs). We investigated a suitable growth curve model in KNCs and estimated the number of days to reach a 2 kg market weight. Body weight was measured at 2-week intervals from birth to 12 weeks of age. The growth curves were estimated using von Berteralanffy, Gompertz, and logistic functions. The results showed that males were significantly heavier than females at all ages, but there were no significant differences in body weight between strains, except at birth and 2 and 6 weeks of age. The coefficients of determination and adjusted determination of growth function had high goodness-of-fit (97.4∼99.7). Of the growth curve parameters, the mature weight and growth ratio were higher in males than in females, but the maturity rate was similar in males and females. The inflection point occurred at approximately 7 weeks of age for females and 8 to 9 weeks of age for males. The weights estimated from the growth curve functions almost agreed with the actual weights, except for male weights estimated using the von Bertalanffy function. The coefficients of determination of the regression equations for weight to age were 0.9583 to 0.9746. The 8- and 10-week-old body weights estimated using the regression equation, and the 12-week-old weight estimated using the logistic function were most similar to the actual weight. Using these models, the estimated age of KNCs to reach 2 kg was 62.0∼64.6 days for males and 74.9∼78.6 days for females.
Keywords: 토종실용닭; 성장곡선; 성숙체중; 성장률; 성숙률
Keywords: Korean native commercial chicken; growth curve; mature weight; growth ratio; maturing rate
서 론
오늘날 식용으로 이용되는 닭고기의 대부분은 실용 육계 (commercial chicken)로써 이들은 거의 브로일러 종이다. 토종닭은 예로부터 주로 백숙과 삼계탕으로 소비되었으나, 최근 튀김 닭 등 요리의 다양화가 이루어지면서 소비되는 닭고기의 대부분은 외국산 종자로부터 생산된 브로일러가 점유하고 있다. 닭 종자의 높은 해외 의존도는 국제 정세 변화에 따라 수급에 심각한 문제를 초래할 수 있으며, 종자의 해외 예속 문제를 심화시킬 수 있다. 따라서 국산 종자 자립 및 종자 수출을 목표로 국가적 차원에서 종자산업 육성 프로젝트(Golden Seed Project)가 수립되고, 닭에서는 종자 보호를 기반으로 수출 및 수입대체를 위한 종계 개발 사업을 진행하게 되었다(Limitless Knowledge Management Institute, 2021). 사업 수행 결과, 종계 분야에 있어서 산육 능력 및 생산 형질이 기존 토종닭보다 훨씬 우수한 새로운 토종닭과 이들을 생산할 수 있는 종계를 개발하였다(Sohn et al., 2021a; Sohn et al., 2021b). 현재 개발된 신품종 토종닭은 상업적으로 출시되어 농가에서 활용되고 있으며, 이들 토종닭에 대해 다양한 연구들이 소개되고 있다(Kim et al., 2017; Lee et al., 2018; Lee et al., 2019; Kim et al. 2020). 그러나 아직 신품종 토종닭의 성장 양상에 대한 매뉴얼이 정립되어 있지 않고 각 주령 별 토종닭의 성장 특성이나 계통별 성장 양상의 비교도 제시되지 않은 실정이다. 성장곡선(growth curve)은 가축의 성장 특성을 파악하는 데 널리 사용되는 분석 지표이다. 이는 추정된 성장곡선 모수를 이용하여 성장률 및 변곡점 등의 다양한 모수를 계산하여 활용할 수 있기 때문이다. 지금까지 성장곡선에 관한 연구는 대부분 종축 및 종계를 대상으로 하였는데, 이는 성장곡선 모수를 이용하여 성장 특성을 규명하여 육종목표와 개량 방향 설정에 기초자료로 활용할 수 있기 때문이다(Lee et al., 2003a; Lee et al., 2003b; Manjula et al., 2017; Kim et al., 2021). 반면, 실용토종닭의 성장곡선을 추정한 연구는 거의 없는데 이는 주령별 체계적 사육 관리를 위해서 반드시 필요한 표준 성장 지표이다.
따라서, 본 연구는 신품종 토종실용닭의 계통과 성별의 성장 능력과 성장곡선을 분석하여 계통과 성별 및 주령별 성장 특성을 규명하고, 추정된 성장곡선과 회귀함수식을 이용하여 토종실용닭의 출하일령 추정에 적합한 모형을 제시하고자 하였다.
재료 및 방법
1. 공시 동물 및 사양 관리
실험에 공시된 자료는 신품종 토종 종계로부터 생산된 실용닭 4계통으로 계통 및 성별에 대한 수수는 Table 1과 같다. 모든 공시계들은 자동 환기 및 온도 조절 시스템을 갖춘 무창계사에서 0~8주령은 육추 케이지(220 cm2/1수)에서, 9~12주령은 성계 케이지(580 cm2/1수)에서 사육하였다. 사료 급여는 시중 육계 배합 사료로 발육 시기에 따라 초이, 전기 및 후기 사료를 자유 급여하였고, 점등 관리는 종야 점등하였다. 그 외 백신 및 기타 사양 관리는 경상국립대학교 종합농장의 사양관리지침에 따라 수행하였으며, 시험에 관련된 닭의 관리 및 취급은 본 대학 동물실험윤리위원회(IACUC, No. 2018-7)의 승인을 얻은 후 규정에 따라 시행하였다.
Table 1.
Number of Korean native commercial chickens used in the test
| Strains |
Female |
Male |
Total |
| FHFY |
95 |
92 |
187 |
| FHHY |
90 |
74 |
164 |
| HFFY |
77 |
79 |
156 |
| HFHY |
89 |
89 |
178 |
| Total |
351 |
334 |
685 |
Download Excel Table
2. 분석 항목 및 방법
1) 체중 분석
체중은 공시한 암수 전 개체를 대상으로 발생시부터 12주까지 2주 간격으로 측정하였고, 측정한 체중 값은 보정없이 원 성적을 그대로 분석에 이용하였다. 체중에 대한 분석 모형은 다음과 같고, 성별과 계통 간 유의성 분석은 R v4.1.0의 ‘GLM’ 함수를 이용하였다. 유의성이 인정되는 경우, 각 계통 간 평균값 비교는 Duncan’s multiple range test로 검정하였다.
여기서,
yijk= i번째 성별, j번째 계통, k번째 개체의 체중
μ= 전체의 평균
Sexi= i번째 성별의 고정효과
Strainj= j번째 계통의 고정효과
eijk= i번째 성별, j번째 계통, k번째 개체의 잔차
2) 성장곡선 추정
성장 곡선은 각 계통과 성별에 따라 Gompertz(Winsor, 1932), Von Bertalanffy(Von Bertalanffy, 1957) 및 Logistic(Nelder, 1961) 모형을 이용하여 추정하였고, 각각의 모형은 Table 2에 제시하였다. Gompertz, Von Beralanffy, Logistic 성장곡선의 성숙체중(A), 성장비율(b) 및 성숙률(k)의 모수 추정을 위해 SAS software v9.4의 PROC NLIN으로 비선형회귀분석을 하였고, Doesn’t Use Derivatives(DUD) 방법(Ralston and Jennrich, 1978)의 ‘method = dud’ 옵션을 이용하였다. 변곡점, 변곡점에서 체중의 추정은 각 성장곡선 모수를 사용하였다. 모형 적합도는 각 성장곡선 모형별 모수를 이용하여 각 개체별 주령에 따라 계산한 예측 값과 실제 체중을 회귀 분석하여 결정계수(R2) 및 수정된 결정계수(adj_R2)를 계산하였다. 추정된 성장곡선 모수는 일령이 무한대인 시점에서의 체중, b는 생시체중에 대한 성숙체중 비율의 log함수, k는 생시체중, 성숙체중, 변곡점 도달일령 및 변곡점에서 체중의 비율 함수로 정의된다. 또한 성장 특성 값인 ti는성장곡선의 기울기가 최대가 되는 일령이고, Wi는 성장곡선의 기울기가 최대가 되는 일령에서의 체중으로 정의된다.
Table 2.
Equations of growth curve function for Korean native commercial chickens
| Function |
Equation1) |
| Gompertz |
|
| Von Bertalanffy |
yt=A(1-b•e−k•t)3 |
| Logistic |
yt=A(1-b•e−k•t)−1 |
Download Excel Table
결과 및 고찰
1. 체중
신품종 토종닭의 계통과 성별에 따른 주령별 체중을 Table 3에 제시하였다. 신품종 토종닭의 체중은 발생시 체중을 제외한 모든 주령에서 수컷이 암컷보다 무겁게 나타났다(P<0.01). 계통 간에는 발생시, 2주령과 6주령 체중에서 유의한 차이를 보였으며(P<0.05) 발생시 체중과 2주령 체중의 경우 모계로 HY를 사용한 계통이 대체적으로 높게 나타났다. 본 연구와 동일한 토종실용닭의 산육 능력에 대한 연구 결과들을 살펴보면, 10주령의 암컷 체중은 1,940.8~2,029.0 g, 수컷은 2,443.7~2,533.0 g으로 보고하여(Sohn et al., 2021b) 본 성적보다 암컷은 약 100 g, 수컷은 약 200 g 정도 높았고, 유사한 계통 간 교배조합 시험에서는 10주령 평균 암컷의 체중이 1,819.7 g, 수컷이 2,154.0 g으로 본 성적보다 다소 낮았다(Kim et al., 2017).
Table 3.
Body weights of Korean native commercial chicken by sex and strains
Value are mean±standard deviation.
| Sex |
Strains |
Weeks |
| Birth |
2w |
4w |
6w |
8w |
10w |
12w |
| Female |
|
|
|
|
----- g ----- |
|
|
|
|
|
FHFY |
43.8±3.7b |
210.5±32.3a |
639.7±78.4 |
1,035.6±110.5a |
1,404.2±171.3 |
1,835.0±180.9 |
2,258.0±225.0 |
|
|
FHHY |
45.1±3.3a |
213.0±27.0a |
635.6±68.9 |
1,006.2±96.4b |
1,380.8±144.4 |
1,838.5±171.1 |
2,317.1±270.0 |
|
|
HFFY |
44.1±3.2b |
198.5±32.0b |
619.1±89.4 |
988.3±106.6b |
1,362.4±151.7 |
1,846.0±138.4 |
2,260.3±206.3 |
|
|
HFHY |
45.3±3.4a |
217.0±57.6a |
643.8±69.6 |
996.7±86.4b |
1,336.5±153.1 |
1,829.3±165.3 |
2,178.9±252.6 |
| Male |
|
|
|
|
----- g ----- |
|
|
|
|
|
FHFY |
44.7±3.5 |
231.1±29.2 |
726.4±76.9 |
1,230.7±93.7 |
1,686.1±132.5 |
2,318.6±230.5 |
2,886.0±272.3 |
|
|
FHHY |
45.3±3.5 |
225.7±30.0 |
718.0±78.0 |
1,191.7±119.8 |
1,671.9±184.8 |
2,292.2±187.6 |
2,890.9±273.4 |
|
|
HFFY |
44.2±3.4 |
222.8±31.7 |
713.8±96.2 |
1,153.0±129.8 |
1,612.9±216.4 |
2,288.3±248.2 |
2,860.9±355.6 |
|
|
HFHY |
45.4±3.3 |
226.3±32.7 |
729.6±94.3 |
1,186.2±145.7 |
1,629.3±203.1 |
2,297.5±280.1 |
2,849.9±345.0 |
| P-value |
|
|
|
|
|
|
|
|
|
|
Sex |
0.2309 |
<0.0001 |
<0.0001 |
<0.0001 |
<0.0001 |
<0.0001 |
<0.0001 |
|
|
Strain |
<0.0001 |
0.0302 |
0.1430 |
<0.0001 |
0.0744 |
0.682 |
0.1920 |
|
|
Sex:Strain |
0.5466 |
0.1863 |
0.9230 |
0.6381 |
0.7747 |
0.8130 |
0.4200 |
Download Excel Table
2. 성장곡선
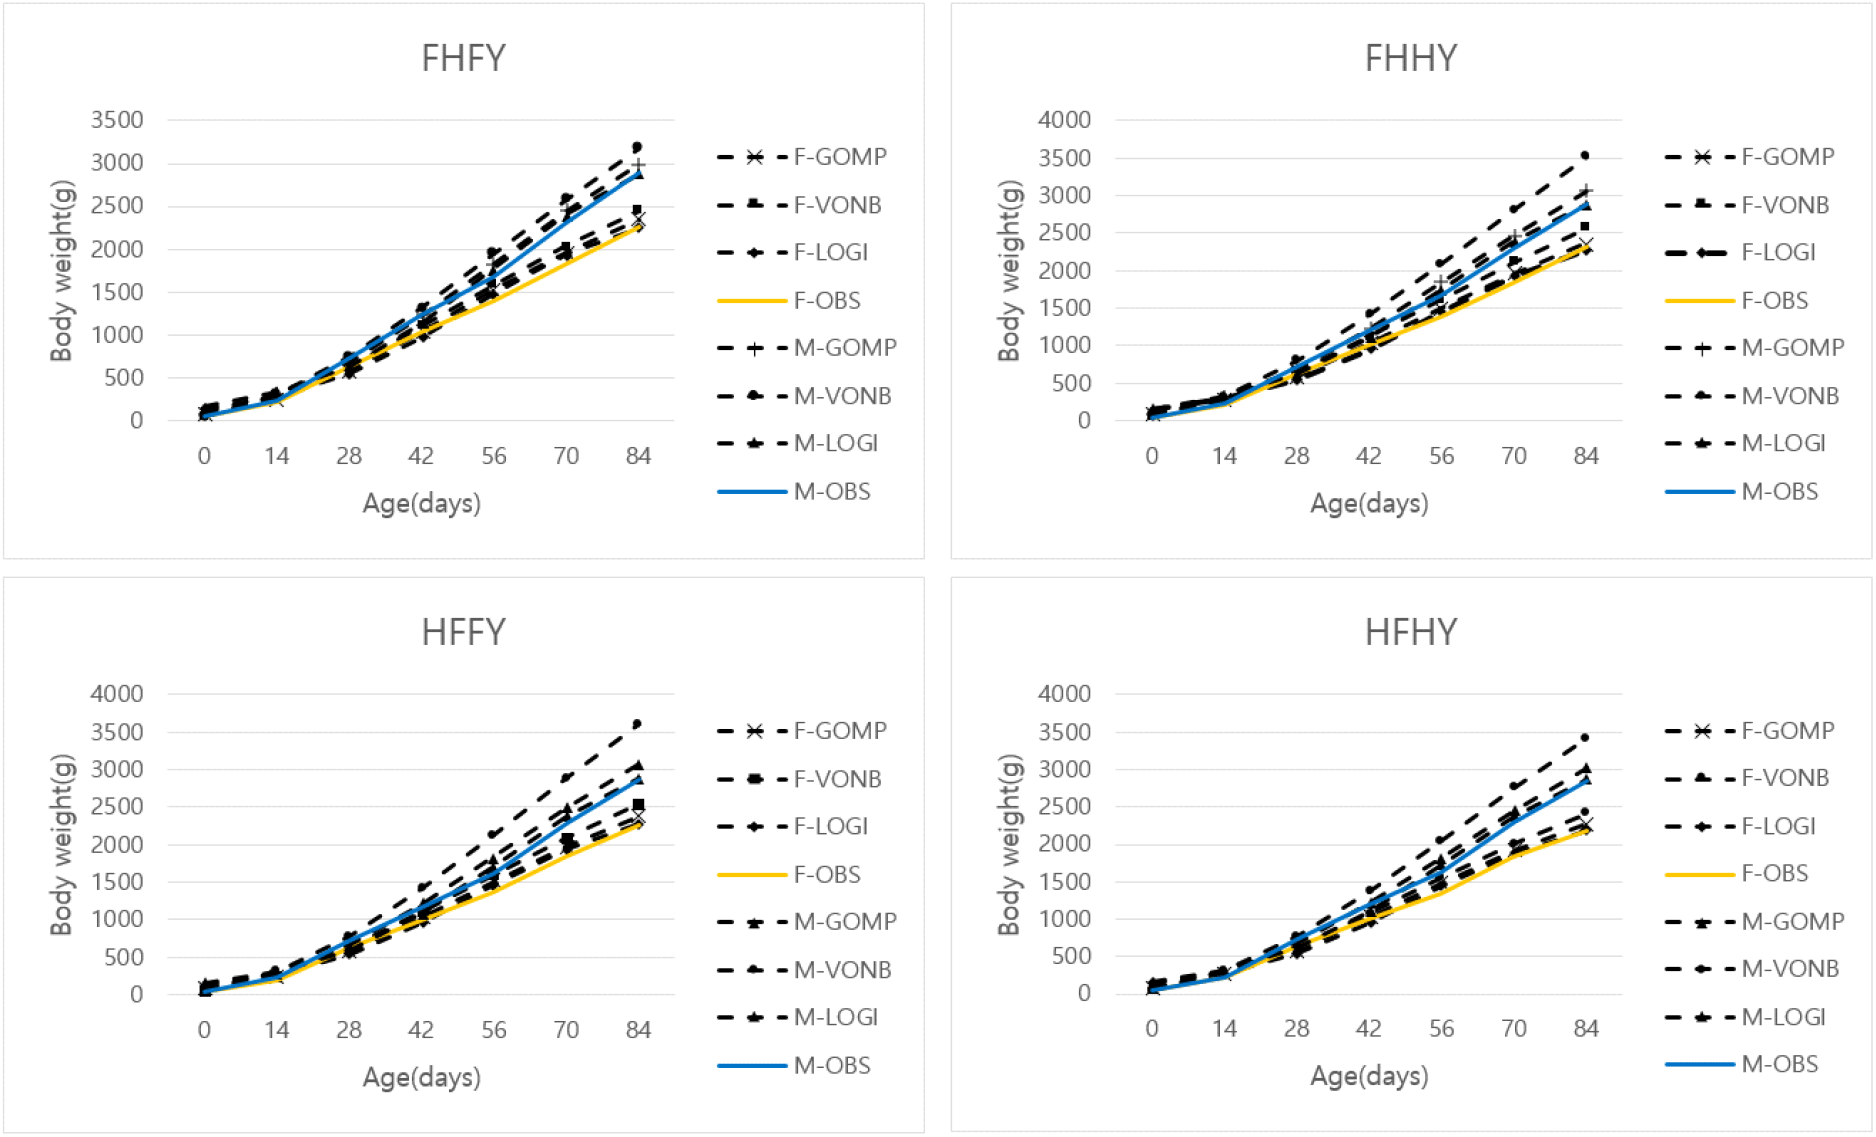
신품종 토종닭의 각 계통, 성별 및 모형별로 추정한 성장곡선을 Fig. 1에 제시하였다. 대부분의 성장곡선모형이 실제 체중을 잘 설명하고 있는 것으로 나타났으나, 수컷에서 Von Bertalanffy 모형은 6주 체중부터 실측치와 다소 차이를 보였다.
Fig. 1.
Growth curves in Korean native commercial chicken by sex, strains and functions. F-GOMP; female growth curve by Gompertz model, F-VONB; female growth curve by Von Bertalanffy model, F-LOGI; female growth curve by Logistic model, F-OBS; female by Observation, M-GOMP; male growth curve by Gompertz model, M-VONB; male growth curve by Von Bertalanffy model, M-LOGI; male growth curve by Logistic model, M-OBS; male by observation.
Download Original Figure
신품종 토종닭 계통과 성별에 따른 성장곡선모형의 적합도를 Table 4에 제시하였다. 성장곡선모형별 결정계수(R2)와 수정된 결정계수(adj.R2)는 97.4~99.7로 나타났다. 각 모형 별 적합도는 계통과 성별에 상관없이 Von Bertalanffy 모형에서 가장 높게 나타났고, Gompertz 모형의 FHHY 수컷과 FHFY 암컷에서 상대적 낮은 적합도를 나타내었다. 신품종 토종닭의 계통, 모형 및 성별에 따라 추정한 성장곡선 모수 A, b, k, ti 를 Table 5에 제시하였다. 추정한 성장곡선 모수는 k를 제외한 모든 모수에서 수컷이 암컷보다 높게 나타났다. 성숙체중(A)은 성별과 계통에서 Von Bertalanffy, Gompertz, Logistic 순으로 높게 나타났다. 이는 토종닭 순계 12계통과 성별에 따른 성장곡선(Kim et al., 2021), 나이지리아 Normal Feather와 Naked Neck 토종닭의 성장곡선(Adenaike et al., 2017), 중국 Shaobo, Youxi-chicken의 성장곡선(Zhao et al., 2015)의 A와 같은 양상으로 나타났고, 나이지리아 Marshall 토종닭의 성장곡선(Adenaike et al., 2017)과 중국 Huauxing 토종닭의 성장곡선(Zhao et al., 2015)의 A와는 다소 다른 양상이었다. 본 시험계의 성장 비율(b)은 암수가 비슷하게 나타났으며 Logistic, Gompterz, Von Bertalanffy모형 순으로 높게 나타났다. 성숙률(k)은 Gompterz, Von Bertalanffy, Logistic 모형에서 암컷이 0.03, 0.02, 0.05~0.06으로 나타났고, 수컷이 0.02~0.03, 0.01~0.02, 0.05로 나타났다. 성숙율(k)은 이의 값이 크면 조숙성, 작으면 만숙성으로 판단되는데, 신품종 토종닭 실용계는 수컷과 암컷의 추정 값이 비슷하여 성별에 따른 조만숙성의 차이는 없다고 사료된다. 변곡점(ti)은 Gompterz, Von Bertalanffy, Logistic 모형에서 모형 간 큰 차이가 없이 암컷은 약 7주령으로
Table 4.
Good-fitness of growth curve model by sex and strains in Korean native commercial chickens
| Parameter1) |
Strain |
Female |
Male |
| GOMP |
VONB |
LOGI |
GOMP |
VONB |
LOGI |
| R2 |
|
|
|
|
|
|
|
|
|
FHFY |
99.4 |
99.5 |
99.0 |
97.7 |
99.6 |
99.1 |
|
|
FHHY |
97.4 |
99.6 |
99.1 |
99.6 |
99.7 |
99.2 |
|
|
HFFY |
99.4 |
99.5 |
99.1 |
99.5 |
99.6 |
99.2 |
|
|
HFHY |
99.4 |
99.5 |
99.0 |
99.4 |
99.4 |
99.3 |
| Adj.R2 |
|
|
|
|
|
|
|
|
|
FHFY |
99.4 |
99.5 |
99.0 |
97.7 |
99.6 |
99.1 |
|
|
FHHY |
97.4 |
99.6 |
99.1 |
99.6 |
99.7 |
99.2 |
|
|
HFFY |
99.4 |
99.5 |
99.1 |
99.5 |
99.6 |
99.2 |
|
|
HFHY |
99.4 |
99.5 |
99.0 |
99.4 |
99.4 |
99.2 |
Download Excel Table
Table 5.
Estimation of growth curve parameters by strains in new synthetic Korean native commercial chickens
| Function1) |
Parameter2) |
Female |
Male |
| FHFY |
FHHY |
HFFY |
HFHY |
FHFY |
FHHY |
HFFY |
HFHY |
| GOMP |
A
|
3,327±57 |
3,674±103.1 |
3,545±85.5 |
3,280±72.2 |
4,829±125.1 |
5,133±163.7 |
5,229±155.5 |
5,050±140.1 |
|
|
b
|
3.84±0.085 |
3.73±0.032 |
3.89±0.041 |
3.74±0.038 |
3.96±0.036 |
3.99±0.031 |
4.1±0.048 |
4.01±0.035 |
|
|
k
|
0.03±0.001 |
0.03±0.001 |
0.03±0.001 |
0.03±0.001 |
0.03±0.001 |
0.02±0.001 |
0.02±0.001 |
0.02±0.001 |
|
|
ti
|
48.8±0.76 |
52.8±1.15 |
52.1±1.01 |
49.2±0.87 |
55.4±1.0 |
59±1.48 |
60.3±1.43 |
58.7±1.24 |
|
|
Wi
|
1284±22.0 |
1399±35.1 |
1368±33.0 |
1266±27.9 |
1864±48.3 |
1981±63.2 |
2019±60.0 |
1949±54.1 |
| VONB |
A
|
4,261±101.4 |
5,081±257.9 |
4,786±189.5 |
4,250±136.4 |
6,712±239.6 |
8,115±510.3 |
8,524±513.2 |
7,827±454.7 |
|
|
b
|
0.78±0.007 |
0.78±0.003 |
0.79±0.006 |
0.78±0.007 |
0.8±0.004 |
0.8±0.003 |
0.82±0.007 |
0.81±0.005 |
|
|
k
|
0.02±0.001 |
0.02±0.000 |
0.02±0.001 |
0.02±0.001 |
0.02±0.000 |
0.01±0.001 |
0.01±0.001 |
0.01±0.001 |
|
|
t i
|
49.9±1.08 |
57.3±2.25 |
55.4±1.66 |
50.7±1.33 |
60.6±1.64 |
69.3±3.16 |
72.2±3.06 |
68±2.68 |
|
|
W i
|
1262±30.1 |
1505±76.4 |
1418±56.2 |
1259±40.4 |
1989±71.0 |
2404±151.2 |
2526±152.1 |
2319±134.7 |
| LOGI |
A
|
2,592±33.6 |
2,707±40.2 |
2,669±44.4 |
2,533±37.5 |
3,473±51.9 |
3,554±64.7 |
3,559±62.3 |
3,532±57.8 |
|
|
b
|
18.61±0.81 |
17.99±0.307 |
19.47±0.414 |
17.49±0.302 |
20.74±0.452 |
21.09±0.468 |
22.73±0.654 |
21.35±0.46 |
|
|
k
|
0.06±0.001 |
0.05±0.001 |
0.06±0.001 |
0.06±0.001 |
0.05±0.001 |
0.05±0.001 |
0.05±0.001 |
0.05±0.001 |
|
|
t i
|
51.3±0.57 |
53.6±0.63 |
53.3±0.70 |
51.4±0.56 |
55.3±0.57 |
56.9±0.77 |
57.4±0.75 |
57±0.65 |
|
|
W i
|
1,296±16.8 |
1,353±20.1 |
1,335±22.2 |
1,266±18.7 |
1,737±25.9 |
1,777±32.3 |
1,780±31.1 |
1,766±28.9 |
Download Excel Table
나타났고, 수컷은 8~9주령으로 나타나, 암컷이 수컷보다 약 10일 정도 빨랐다. 암컷의 변곡점은 모든 모형에서 FHFY 계통이 가장 빠르게 나타났고 FHHY 계통이 가장 느리게 나타났다. 수컷의 변곡점은 Von Bertalanffy 모형이 다른 모형에 비해 높게 나타났으며, HFFY 계통이 가장 높게 나타났다. 변곡점에서 체중(Wi)은 Gompterz, Von Bertalanffy, Logistic 모형에서 암컷이 1,266~1,399 g, 1,259~1,505 g, 1,266~1,353 g으로 나타났고, 수컷이 1,864~2,019 g, 1,989~2,526 g, 1,737~1,780 g으로 나타났다.
3. 2 Kg 도달일령 추정
신품종 토종닭의 계통과 성별에 대한 일령에 따른 체중의 1차와 2차 회귀함수식과 이의 결정계수를 Table 6에 제시하였다. 결정계수는 선형 회귀방정식이 0.9452~0.9652로 나타났고, 2차 회귀방정식은 0.9583~0.9746로 나타나 일령에 따른 체중 예측 값의 신뢰도가 매우 높았다. 토종닭 일령에 따른 체중에 대한 회귀함수식의 결정계수 분석에서 Kim et al.(2017)은 0.9418로, Sohn et al.(2021b)은 0.8919~0.9514로 보고하여 본 연구의 결정계수가 이들의 결정계수보다 더 높은 것으로 나타났다.
Table 6.
Estimation of regression equations of body weight on age in new synthetic Korean native commercial chickens.
| Strain |
Equation1) |
Female |
Male |
| FHFY |
Reg.1 |
y=27.18x-80.78 (R2=0.9618) |
y=34.84x-160.04 (R2=0.9639) |
|
|
Reg.2 |
y=0.075x2+20.88x-7.29 (R2=0.9661) |
y=0.151x2+22.12x-11.62(R2=0.9746) |
| FHHY |
Reg.1 |
y=27.58x-96.10 (R2=0.9585) |
y=34.75x-168.86 (R2=0.9459) |
|
|
Reg.2 |
y=0.106x2+18.72x+7.33(R2=0.9667) |
y=0.167x2+20.75x-5.49(R2=0.9587) |
| HFFY |
Reg.1 |
y=27.26x-99.49 (R2=0.9652) |
y=34.39x-173.48 (R2=0.9452) |
|
|
Reg.2 |
y=0.099x2+18.97x-2.80(R2=0.9726) |
y=0.178x2+19.42x+1.14(R2=0.9601) |
| HFHY |
Reg.1 |
y=26.32x-70.17 (R2=0.9596) |
y=34.33x-161.10 (R2=0.9460) |
|
|
Reg.2 |
y=0.072x2+20.23x+0.87(R2=0.9639) |
y=0.161x2+20.78x-3.06(R2=0.9583) |
Download Excel Table
신품종 토종닭 계통 및 성별에 따른 성장곡선과 회귀식으로 8, 10, 12 주령의 체중 예측치를 추정하여 이를 Table 7에 제시하였다. 성장곡선 모형 중 Logistic 모형이 가장 실제 체중을 잘 설명하고 있다. 주령별 체중 예측값을 보면, 8주령과 10주령 체중은 모든 계통과 성별에서 1차와 2차 회귀 추정 값이 실제 체중과 가장 비슷하게 나타났고, 12주령 체중은 FHHY계통의 암컷을 제외하고는 Logistic 모형의 추정 값이 실제 체중과 가장 비슷하게 나타났다. 그러나 본 연구에 이용된 대부분의 성장곡선 모형들은 성장 후반기에 들어 실제 체중보다 다소 높은 곡선 형태를 보이고 있다. 성장곡선의 각 함수식을 이용하여 신품종 토종닭 계통 및 성별에 따른 2 kg 도달 출하일령 예측값을 Table 8에 제시하였다. 출하일령은 모든 계통 및 성별에서 Von Bertalanffy 모형이 가장 빠르게 나타났고, 1차 회귀식이 가장 느리게 나타났다. 이상의 모든 성장곡선 모형을 이용하여 2 kg 도달일령의 평균 예측 일수를 추정한 바 계통 간 차이는 거의 없는 것으로 나타났고, 수컷은 60~61일, 암컷은 72~73일로서 암수 간 약 12일 정도의 차이를 보였다. 그러나 Table 7과 Table 8을 종합할 때, 토종닭 암수 2 kg 도달일령에서 실제 체중과 가장 유사한 값은 회귀식으로 추정한 값으로서 암수 출하일령의 예측은 모두 회귀식으로 추정하는 것이 바람직하다고 사료된다. 따라서, 수컷 4계통의 2 kg 출하일령은 62.0~64.6일, 암컷은 74.9~78.6일로 추정된다. 토종실용닭의 출하일령에 대한 선행 연구들을 살펴보면, Kim et al.(2017)은 13개조합의 토종닭의 2 kg 출하일령을 암수 평균 71.8일로 보고하였고, Sohn et al.(2021b)은 이들의 1.9 kg 도달일령을 60.3~73.2일로 보고하여 본 토종닭의 출하 체중 도달일령이 이들에 비해 다소 단축된 결과를 나타내었다.
Table 7.
Estimation of body weights at 8, 10 and 12 weeks in new synthetic Korean native commercial chickens using several growth curve equations
| Strain |
Equation |
Female |
Male |
| 8 weeks |
10 weeks |
12 weeks |
8 weeks |
10 weeks |
12 weeks |
| FHFY |
Reg.1 |
1,442 |
1,822 |
2,203 |
1,791 |
2,279 |
2,767 |
|
|
Reg.2 |
1,397 |
1,822 |
2,276 |
1,702 |
2,279 |
2,915 |
|
|
GOMP |
1,523 |
1,968 |
2,338 |
1,836 |
2,446 |
2,994 |
|
|
VONB |
1,582 |
2,039 |
2,448 |
1,943 |
2,578 |
3,182 |
|
|
LOGI |
1,479 |
1,938 |
2,251 |
1,772 |
2,403 |
2,878 |
|
|
OBS |
1,404 |
1,835 |
2,258 |
1,686 |
2,319 |
2,886 |
| FHHY |
Reg.1 |
1,448 |
1,835 |
2,221 |
1,686 |
2,319 |
2,886 |
|
|
Reg.2 |
1,386 |
1,835 |
2,324 |
1,679 |
2,264 |
2,914 |
|
|
GOMP |
1,501 |
1,963 |
2,369 |
1,844 |
2,478 |
3,057 |
|
|
VONB |
1,614 |
2,108 |
2,569 |
2,099 |
2,814 |
3,508 |
|
|
LOGI |
1,449 |
1,924 |
2,274 |
1,742 |
2,385 |
2,887 |
|
|
OBS |
1,381 |
1,838 |
2,317 |
1,672 |
2,292 |
2,891 |
| HFFY |
Reg.1 |
1,427 |
1,809 |
2,191 |
1,752 |
2,234 |
2,715 |
|
|
Reg.2 |
1,369 |
1,809 |
2,287 |
1,647 |
2,234 |
2,890 |
|
|
GOMP |
1,511 |
1,977 |
2,377 |
1,839 |
2,488 |
3,085 |
|
|
VONB |
1,599 |
2,090 |
2,541 |
2,132 |
2,879 |
3,608 |
|
|
LOGI |
1,461 |
1,940 |
2,280 |
1,717 |
2,373 |
2,886 |
|
|
OBS |
1,362 |
1,846 |
2,260 |
1,613 |
2,288 |
2,861 |
| HFHY |
Reg.1 |
1,404 |
1,772 |
2,141 |
1,761 |
2,242 |
2,722 |
|
|
Reg.2 |
1,361 |
1,772 |
2,212 |
1,666 |
2,242 |
2,880 |
|
|
GOMP |
1,484 |
1,914 |
2,276 |
1,823 |
2,450 |
3,021 |
|
|
VONB |
1,553 |
2,003 |
2,408 |
2,050 |
2,748 |
3,424 |
|
|
LOGI |
1,440 |
1,881 |
2,187 |
1,732 |
2,373 |
2,873 |
|
|
OBS |
1,336 |
1,829 |
2,179 |
1,629 |
2,297 |
2,850 |
Download Excel Table
Table 8.
Estimation of days to reach a 2 kg market-weight in new synthetic Korean native commercial chickens by several growth curve equations
| Strain |
Equation1) |
Female (days) |
Male (days) |
| FHFY |
Reg.1 |
76.5 |
62.0 |
|
|
Reg.2 |
75.6 |
63.4 |
|
|
GOMP |
71.1 |
59.7 |
|
|
VONB |
68.7 |
57.3 |
|
|
LOGI |
72.3 |
60.8 |
|
|
Means |
72.8 |
60.6 |
| FHHY |
Reg.1 |
76.0 |
62.4 |
|
|
Reg.2 |
74.9 |
63.9 |
|
|
GOMP |
71.2 |
59.4 |
|
|
VONB |
66.9 |
54.0 |
|
|
LOGI |
72.6 |
61.4 |
|
|
Means |
72.3 |
60.2 |
| HFFY |
Reg.1 |
77.0 |
63.2 |
|
|
Reg.2 |
75.7 |
64.6 |
|
|
GOMP |
70.7 |
59.4 |
|
|
VONB |
67.4 |
53.5 |
|
|
LOGI |
72.1 |
61.9 |
|
|
Means |
72.6 |
60.5 |
| HFHY |
Reg.1 |
78.6 |
63.0 |
|
|
Reg.2 |
77.4 |
64.3 |
|
|
GOMP |
73.1 |
59.9 |
|
|
VONB |
69.9 |
55.0 |
|
|
LOGI |
74.7 |
61.7 |
|
|
Means |
74.7 |
60.8 |
Download Excel Table
사사
본 논문은 경상국립대학교 동물생명산업센터의 지원으로 수행되었음.
REFERENCES
Adenaike A, Akpan U, Udoh J, Wheto M, Durosaro S, Sanda A, Ikeobi C 2017 Comparative evaluation of growth functions in three broiler strains of Nigerian chickens. Pertanika J Trop Agric Sci 40(4):611-620.

Kim CH, Kang HK 2020 Effect of stock density on the growth performance, and meat quality of Korean native chickens. Korean J Poult Sci 47(1):1-7.

Kim KG, Choi ES, Kwon JH, Sohn SH 2017 The effect of early chick weight on market-weight in Korean native chickens. Korean J Poult Sci 44(4):259-265.
Kim KG, Park B, Jeon IS, Choo HJ, Ham JJ, Park K, Cha HB 2021 A comparative study on the growth performance of Korean indigenous chicken pure line by sex and twelve strains. Korean J Poult Sci 48(4):193-206.
Lee CW, Choi JG, Jeon GJ, Na KJ, Lee C, Yang BK, Kim JB 2003a Estimation of growth curve for evaluation of growth characteristics for Hanwoo cows. J Anim Sci and Technol 45(4):509-516.
Lee CW, Choi JG, Jeon GJ, Na KJ, Lee C, Hwang JM, Kim BW, Kim JB 2003b Estimation of parameters for individual growth curves of cows in Bostaurus Coreanae. J Anim Sci and Technol 45(5):689-694.
Lee SY, Park JY, Hyun JM, Jung S, Jo C, Nam KC 2018 Comparative analysis of meat quality traits of new strains of native chickens for Samgyetang. Korean J Poult Sci 45(3):175-182.
Lee SY, Park JY, Nam KC 2019 Comparison of micronutrients and flavor compounds in breast meat of native chicken strains and Baeksemi for Samgyetang. Korean J Poult Sci 46(4):255-262.
Limitless Knowledge Management Institute 2021 Analysis of the Economic Effect of Improving GSP-Korean Native Chickens and Developing New Chicken Breeds. Report.
Manjula P, Park HB, Seo D, Choi N, Jin S, Ahn SJ, Heo KN, Kang BS, Lee JH 2018 Estimation of heritability and genetic correlation of body weight gain and growth curve parameters in Korean native chicken. Asian-Australas J Anim Sci 31(1):26-31.
,

,

Nelder JA 1961 The fitting of a generalization of the logistic curve. Biometrics 17:89-100.
Ralston ML, Jennrich RI 1978 DUD, a derivative-free algorithm for nonlinear least squares. Technometrics 20(1):7-14.
Sohn SH, Choi ES, Kim KG, Park B, Choo HJ, Heo JM, Oh KS 2021a Development of a new synthetic Korean native chicken breed using the diallel cross-mating test. Korean J Poult Sci 48(2):69-80.
Sohn SH, Choi ES, Cho EJ, Kim BG, Shin KB, Lee SG, Oh KS 2021b Crossbreeding combination test for the production of new synthetic Korean native commercial chickens. Korean J Poult Sci 48(3):101-110.
Von Bertalanffy L 1957 Quantitative laws in metabolism and growth. Quart Rev Biol 32(3):217-231.
,
Winsor CR 1932 The Gompertz curve as a growth curve. Proc Natl Acad Sci 18(1):1-8.
,
,
Zhao Z, Li S, Huang H, Li C, Wang Q, Xue L 2015 Comparative study on growth and developmental model of indigenous chicken breeds in China. Open J Animal Sci 5(2):219-223.